How much is it worth?
Positioned at the intersection of audience measurement and sports media analysis, we determine the fair market value for sponsorship and media rights across platforms, creating the perfect lineup for an optimized partnership portfolio.

SPONSOR VALUE
Our media valuation expertise of sponsorship assets captures audiences across all media types from TV, social, digital, OTT and print while using one consistent methodology.

SPONSOR IMPACT
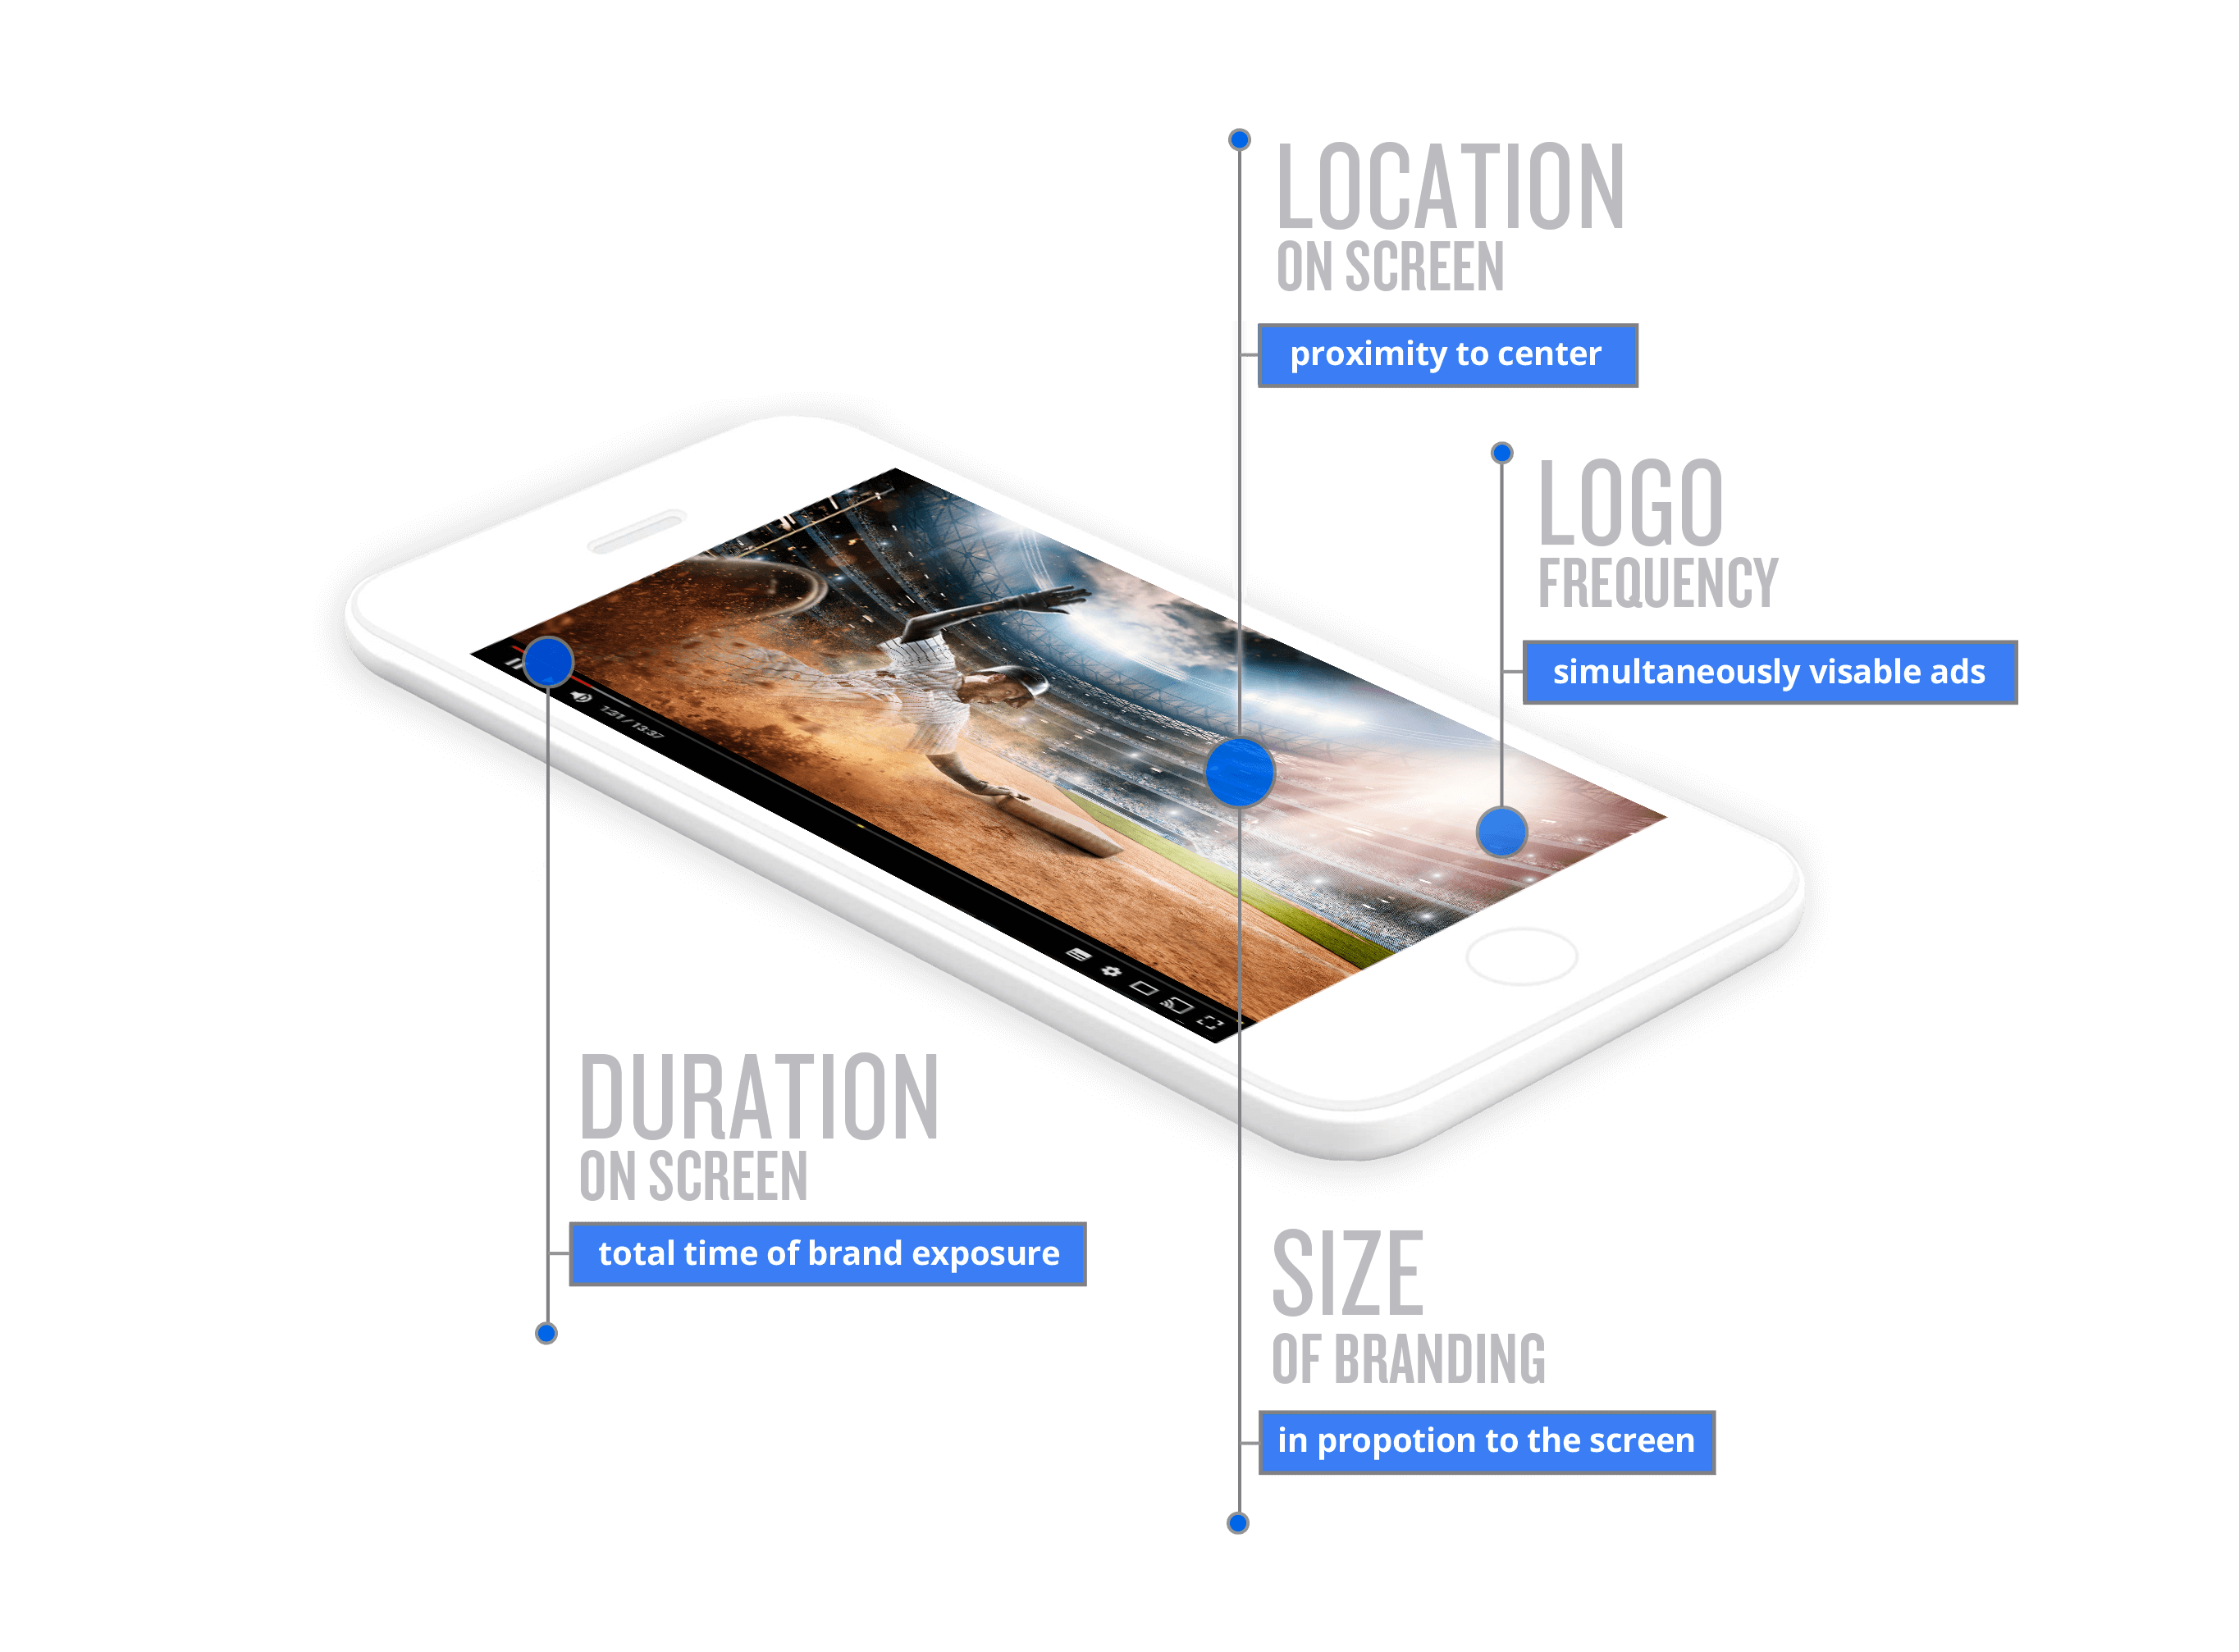
We use data to identify the driving factors between sponsorship execution and the impact of media value, helping you understand what works.
HOLISTIC DATA
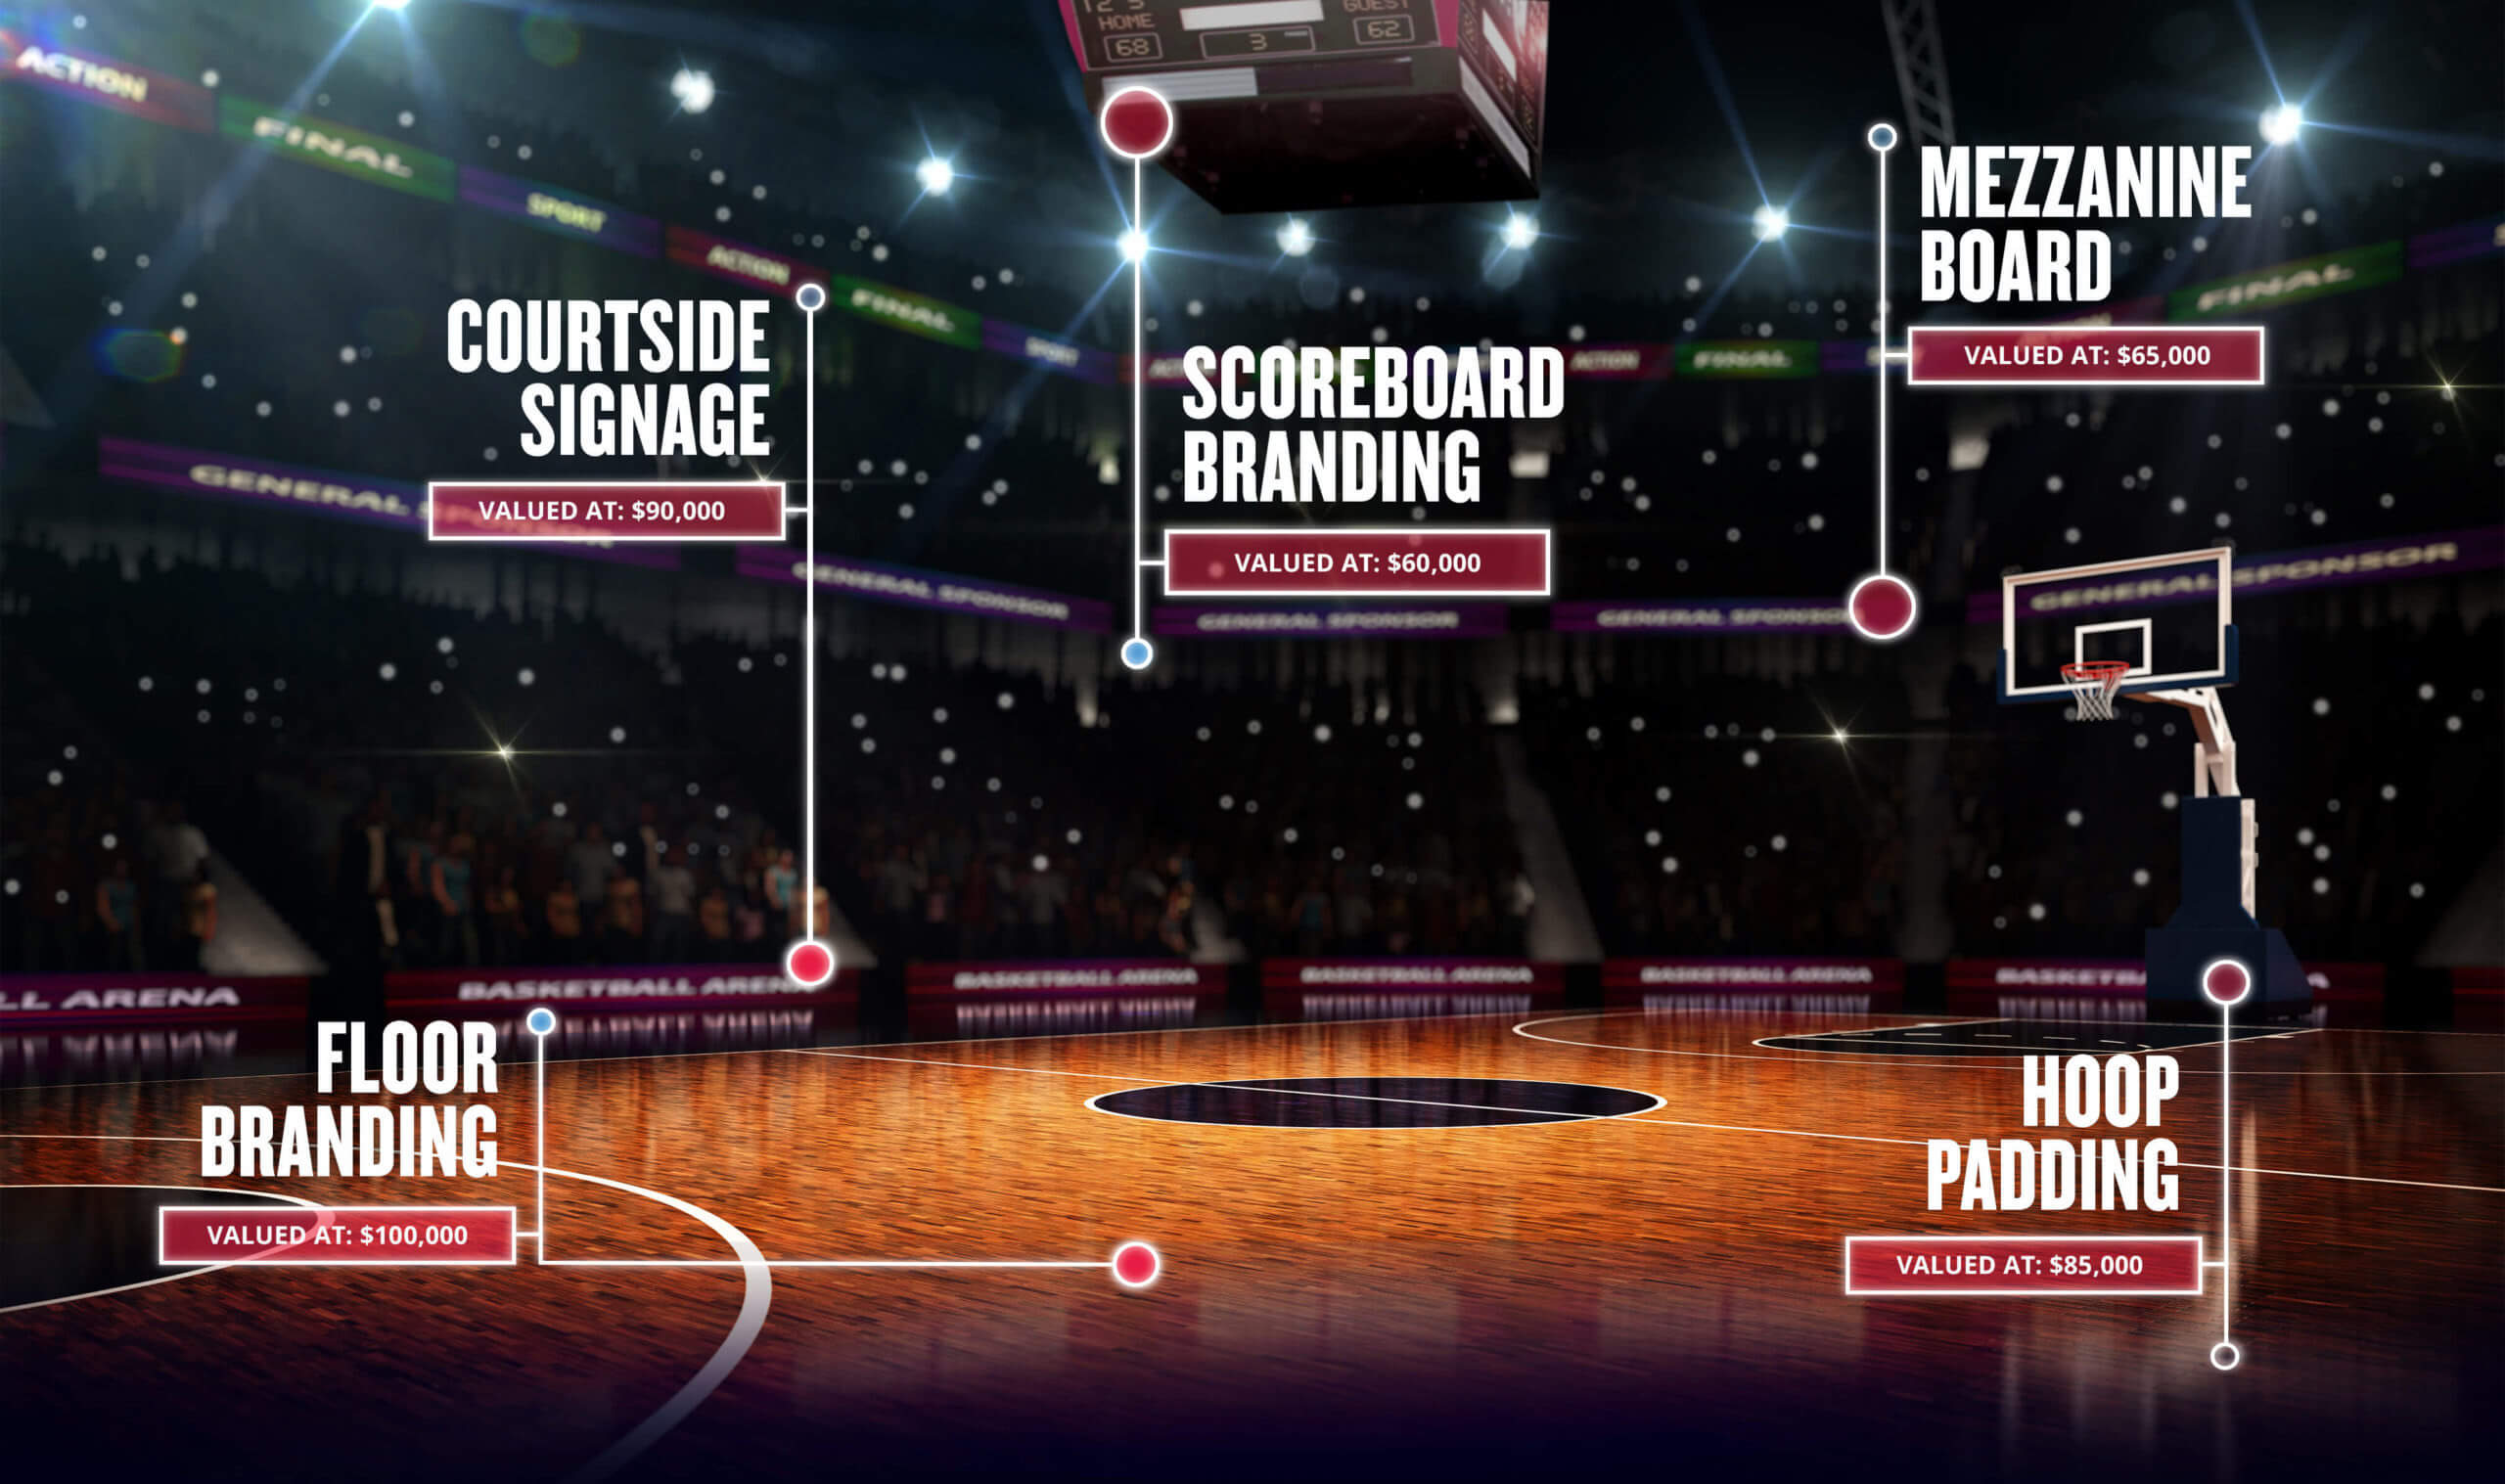
We objectively calibrate the maximum media value of sports sponsorships by asset, media type and platform.

ELITE TECHNOLOGY PERFORMANCE
From TV to OTT and print, we provide contextually relevant insights and data using advanced AI technology with human oversight. Know your data inside and out.
THE SCOREBOARD
We dig deep to provide multichannel media valuation data that includes all screens and devices at the local, national and international level using Nielsen’s Quality Index (QI) methodology - a consistent and credible global measurement standard to uncover the true value of sponsorship activations.
HIGH DEF DATA
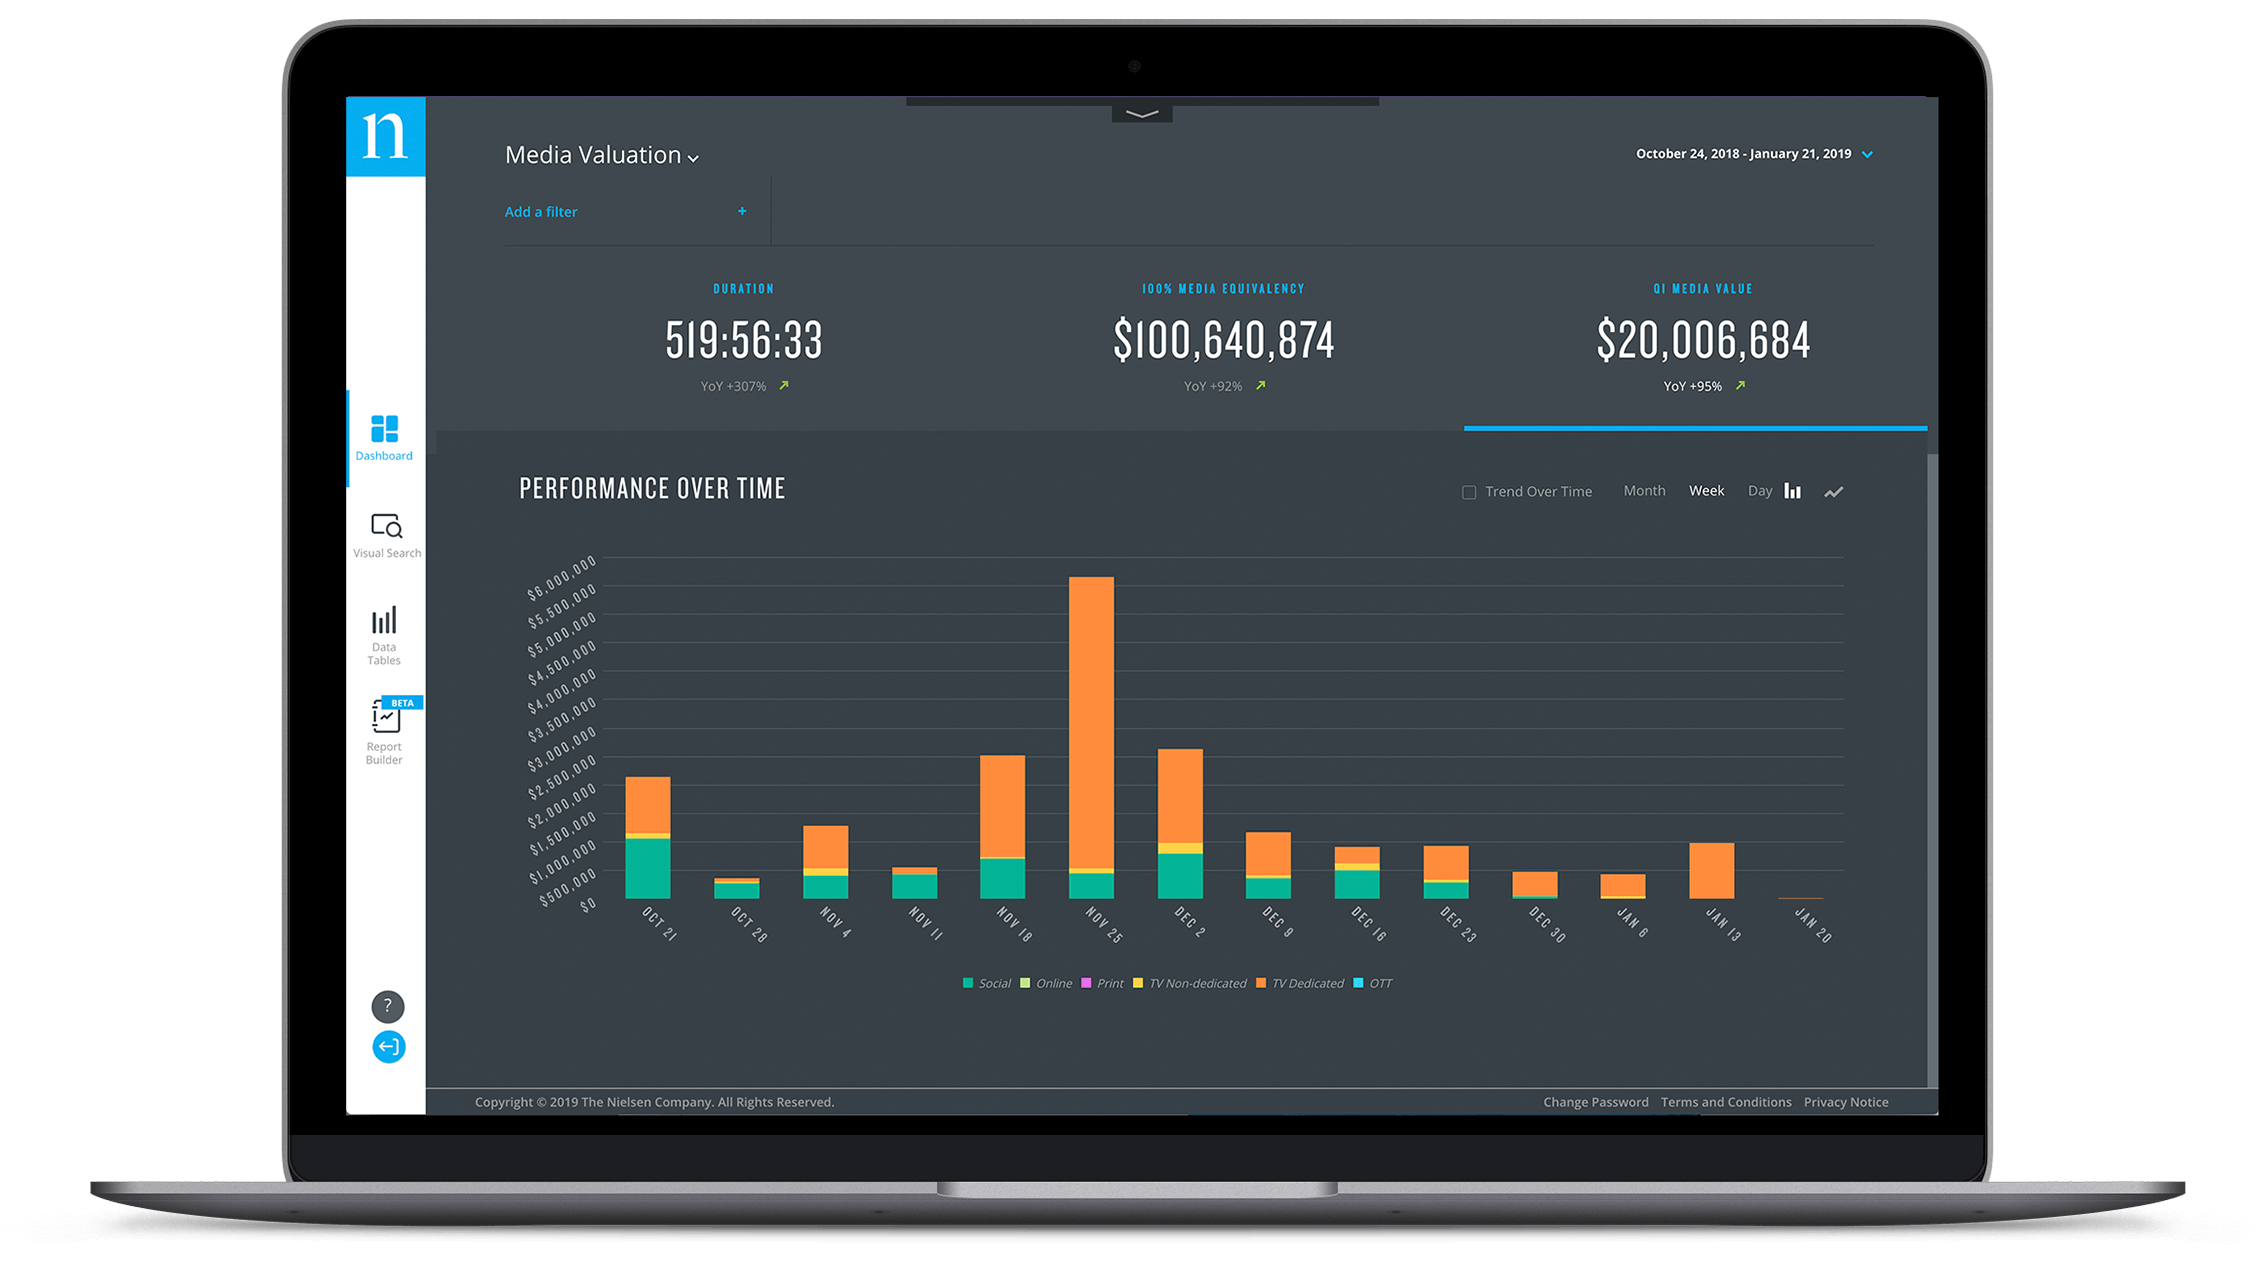
Nielsen Sports Connect is your valuation decathlete, delivering syndicated media valuation data from multiple media sources.
Our independent online platform gathers datasets and market intelligence and delivers them in a straightforward and intuitive interface - giving you the knowledge and perspective to build your bottom line.

Assert Control With Customizable Dashboards
No holds barred accessibility. Roll up metrics across media types and markets for total measurement visibility.

Instant Replay Through Visual Search
View branded social posts and TV imagery with associated valuation metrics.
Design Your Lineup With Data Tables
Drill down and customize data by media type with export functionality.
Game Winning Insights Using Report Builder
Develop end-to-end custom reports using dynamic filters and data visualization. Easily export to PowerPoint for presentation.