One of the key challenges for the sponsorship industry is to measure Return on Investment (ROI) of sponsorship investments and activity.
When speaking to clients we know they are challenged to report internally and make sponsorship decisions based on data, but it can be hard to define which of many metrics to use and what they really mean.
Working within Nielsen it is clear that measuring marketing, and therefore also sponsorship, can be evaluated on three key areas:
- Reach
- Brand Equity
- Behaviour Change
Each brand and sponsorship will have different objectives against some or all of these pillars and with many different internal and external measures the challenge is to connect these data points to create a meaningful return metric.
Return on Sponsorship Investment
When setting up sponsorship objectives against the three pillars above, our view is that sponsorship teams should have the ability to translate data into clear KPI’s to measure against the brand’s marketing or business objectives.
Our Return on Sponsorship Investment model (ROSI) can deliver this simplification of metrics, it provides a concise and comparable overview of the performance of your sponsorship portfolio, with the ability to benchmark the success against the wider industry.
The model utilises data points generated across Reach, Brand Equity and Behavioural Change. The outputs are delivered in an understandable format that can easily compare multiple partnerships over time periods. Partnerships can be compared together regardless of the type or objective, whether global or local, ambassador or CSR, high media value or low.
The Process
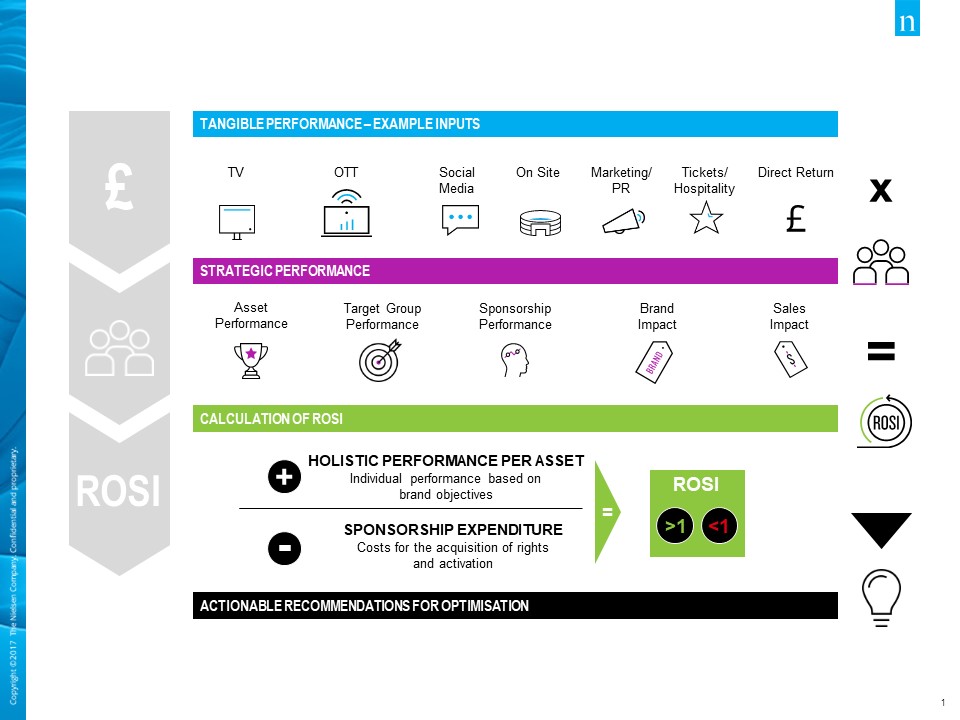
The first step of the model is to assess monetary returns from the rights delivered and all sponsorship assets activated. This can include cross channel media evaluation from exposure generated, earned coverage, results of paid media campaigns and actual sales data where measurable.
The next step is to measure the strategic performance of the sponsorship, this is done through market research set up to specifically measure the sponsorship’s objectives. This part measures how the sponsorship resonates and reaches the target market, as well the impact on brand equity metrics like awareness, image and consideration. This, therefore, can measure how the sponsorship and activation is impacting brand marketing metrics such as shifting brand image or moving up the consideration set.
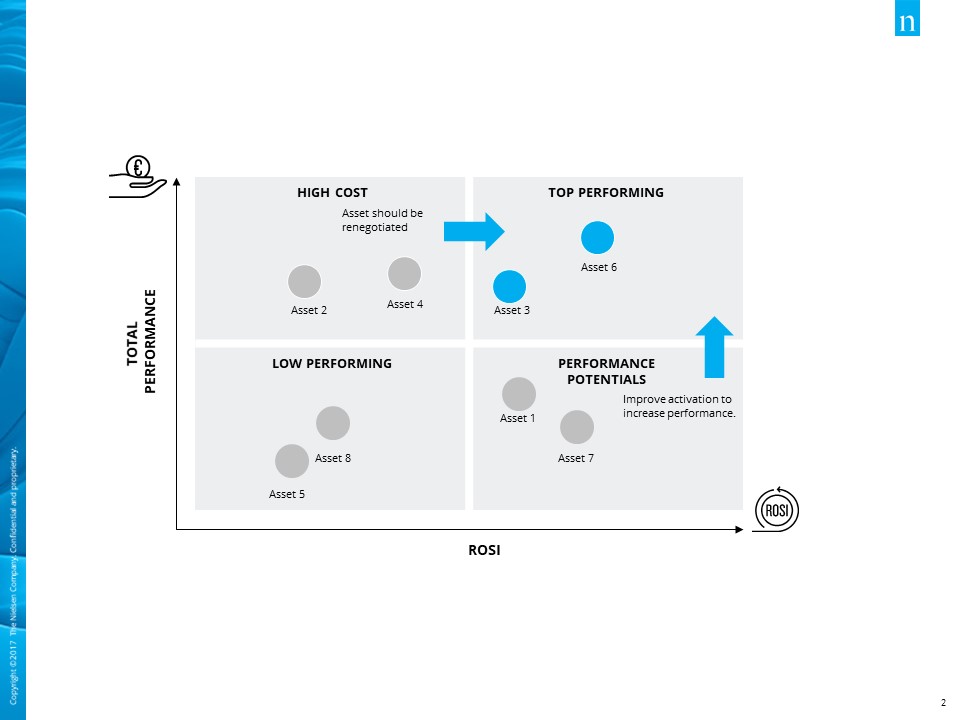
The strategic performance scorecard results in a weighting factor, which is applied to the monetary returns. This is then divided by the rights fee and activation costs to create a simple ROSI score. If the result is less than 1, you invest more in your partnership than it returns, and we use the detailed strategic performance research to identify the actions required to improve the partnership. If the ROSI score is bigger than 1, you are driving more value from your partnerships than you actually paid for.

The Outcome
The ROSI score can be compared across a brand’s portfolio or across industry benchmarks. This enables data-driven simple internal reporting and decision making, as to whether a sponsorship is performing well, needs to be optimised or is better divested.

We believe the key benefits of ROSI for brands are:
- A clear and effective way to communicate performance internally
- To be able to measure a sponsorship’s performance against a defined set of objectives
- To allow a direct and fair comparison when an organisation has a large and diverse sponsorship portfolio